On the morning of Saturday, March 22, 2014, a major landslide occurred near the city of Oso, Washington, instantly devastating the Steelhead community in its path and drastically altering the landscape. Esri’s Disaster Response Team quickly published a set of maps and services to better understand the scale and impact of this event, including a Story Map to compare the before/after imagery of the slide area.
After hearing about the event and the work Esri was doing to support the recovery efforts, it became clear that a 3D version of the swipe map might provide a new perspective on the landslide and its scale. The Oso slide has since been ranked as the most deadly single landslide event in U.S. history, “excluding volcanic, earthquake, dam collapse, or multiple area-wide events.” (source) A 2D map is a good place to begin understanding an event like this, but the same source data can be used to quickly produce an immersive 3D scene.

To create the 3D before & after comparison of the Oso slide area, we used ArcGIS and CityEngine to generate a model of the area and published a set of interactive web scenes to ArcGIS Online. In doing this we were able to reuse many of the same before & after datasets we were using in the other 2D maps of Oso, including:
- Bare earth terrain surface, or digital terrain model (DTM)
- First return surface, or digital surface model (DSM)
- Imagery
- Operational data
- Structure locations w/condition
- Slide extent polygon

Two unique web scenes were created—one to show the bare earth terrain (Digital Terrain Model), and another showing vegetation and other structures on the surface (Digital Surface Model). Within each of these scenes, before and after versions of the imagery and surfaces were grouped, allowing users to compare the two in the web scene viewer.
The first step was to prepare the following datasets in ArcGIS before they were brought into CityEngine:
- A rectangular area of interest (AOI) for the web scene that contains the affected area and the datasets.
- Clip the before DTM and DSM produced by the Puget Sound LiDAR Consortium (collected between April – July 2013) and export them to TIFFs (with .tfw).
- Generate the after DTM and DSM rasters from the Washington State Dept. of Transportation lidar dataset (collected March 24, 2014). Then clip and export them to TIFF.
- Clip the before (ArcGIS World Imagery) and after imagery (from this service) to the AOI and export them. (Note: The imagery size should be less than 4000 x 4000 pixels for use in CityEngine.)
- Obtain additional operational data, including:
- Damaged structures from this feature service
- Preliminary landslide extent polygon from USGS Open File Report 2014-1065
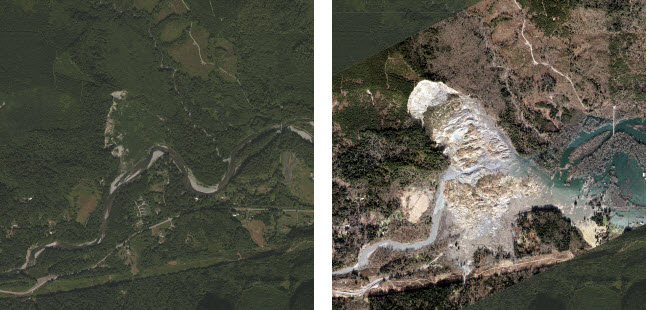
Before (Left) and After (Right) Imagery
Once the layers were prepared, a new CityEngine Project and Scene were created using the local North Washington State Plane coordinate system (WKID 2285). The bare-earth scene was created first, so that dwelling inspection points could be aligned with the terrain surface.
Step 1: Import the before DTM (File > Import > Terrain Import) and the accompanying Texture (image) to be draped on top.
 Step 2: Import the corresponding after DTM and Texture (image) pair.

Rename the two terrain layers so that we could tell them apart.

Step 3: Import the Structure inspection points to the scene (File > Import > File GDB Import). With the points selected, they were aligned to the Bare Earth Before surface (Shapes > Align Shapes to Terrain).

Step 4: Apply a simple CityEngine rule to symbolize the points according to the condition of the structure. I used the built-in cube symbol (we didn’t yet have building footprints when the scene was made) and a series of case statements according to the level of damage to color the cubes (below is a sampling):
Dwellings-->

case Level_ == "Destroyed" :

alignScopeToAxes(y)

i("builtin:cube")

color(destroyColor)

set(material.opacity,0.75)

s(symbolSize,symbolSize,symbolSize)

center(xz)

case Level_ == "Limited" :

(etc.)
With an X/Y/Z symbol size of 7 meters, each cube (shown below) is ~23 feet tall (approximating a 1-2 story building height).

Step 5: The scene was finished by adding the other operational layers. You could add more, such as, a slide extent, a street network showing closures or depths, emergency assets, or vertical change.
Before exporting the CityEngine scene to a web scene file, a few bookmarks were added to show different parts of the landslide and affected areas. These can be navigated to individually, or played as a tour using the arrow button.
 When the scene was ready to export, I selected all features in the 3D viewport of the scene (CTRL+A), and exported it (File > Export Models > CityEngine WebScene). I provided a Scene Name, then setup the layer grouping.

The highlighted Per Layer Options above are important to understand:
- Group Name: If you would like to compare 2 (or more) layers, give them a common Group Name. This will enable the swipe and compare tools in the exported web scene.
![Layers Tab]()
- State & Interaction: The State determines whether the layer is a Backdrop (not listed in the Layer list, always present), Visible on load, or Hidden when the scene loads. Interaction determines whether you can select a feature or not (not relevant for terrains, which cannot be queried).
- Textures: The texture quality can be selected from a drop-down, progressively down-sampling the original images. Because our scene is relatively simple and we want the maximum quality for the imagery, Original Textures is used. This is the highest quality setting. Note that using original texture sizes may cause problems for larger scenes or scenes with many unique textures (e.g., building facades).

Once exported, the web scene was uploaded to our ArcGIS Online account and shared. This can be done in CityEngine (File > Share As) or by uploading the exported web scene (.3ws) file in ArcGIS Online.
The same process was repeated for the DSM version of the web scene, showing vegetation and building heights in the terrain.
Take a tour of the bare-earth and surface model Oso landslide web scenes and leave any feedback or questions below.
Contributed by Craig McCabe